
Every theme park guide says the same thing: arrive at rope drop, beat the crowds. Our data says that advice is wrong for at least half the parks on this list.
Theme Park Shark tracks wait times at 9 parks every 10 minutes. We analyzed 116,000+ records to find the actual best and worst time to visit each park. The results contradict conventional wisdom in several surprising ways.
The biggest surprise: Disneyland’s best time is 8 AM, not mid-afternoon — and it’s the lowest-wait window of any park on this list. At 8 AM PT, Disneyland averages just 13 minutes per ride. By noon, waits have more than doubled to 34 minutes. Rope drop IS the strategy here, but for a different reason than most guides explain.
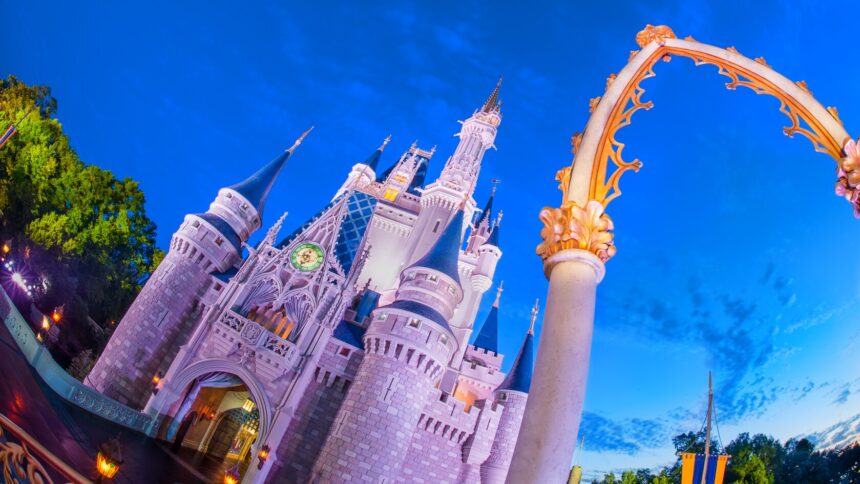
Magic Kingdom: Go Early or Go Late — Avoid the Middle
Magic Kingdom has the clearest pattern of any Disney park: waits build through the morning, plateau in the afternoon, then drop in the evening.
| Time (ET) | Avg Wait | Verdict |
|---|---|---|
| 8:00 AM | 16 min | ✅ Best window |
| 9:00 AM | 21 min | Good |
| 10:00 AM – 6:00 PM | 25–36 min | ⚠️ Crowded |
| 9:00 PM | 19 min | ✅ Strong evening option |
| 10:00 PM | 18 min | ✅ Very quiet |
Strategy: Arrive at park open and get your top 2-3 rides done before 10 AM. If you’re staying late, the last 2 hours of the day have waits close to morning levels. The midday window (11 AM – 5 PM) is when to take a break, eat, or use Lightning Lane.
Hollywood Studios: Leave Before 1 PM or Come After 7 PM
Hollywood Studios has the most dramatic daily swing of any park we track: from 29 minutes at 8 AM to 72 minutes at 1 PM. That’s a 2.5x increase in just 5 hours.
| Time (ET) | Avg Wait | Verdict |
|---|---|---|
| 8:00 AM | 29 min | ✅ Best window |
| 9:00 AM | 46 min | Building fast |
| 10:00 AM – 1:00 PM | 63–72 min | 🔴 Worst hours |
| 2:00 PM – 6:00 PM | 55–67 min | Still heavy |
| 7:00 PM – 9:00 PM | 27–47 min | ✅ Evening recovery |
Strategy: Hollywood Studios is unforgiving unless you’re there at park open. The first hour (8–9 AM) is the only window where waits are reasonable without Lightning Lane. After 9 AM, waits spike fast and stay elevated until evening. If you’re arriving midday, budget heavily for Lightning Lane or expect long waits on every major ride.
EPCOT: Go at Rope Drop — There’s No Relief Otherwise
EPCOT’s data tells an uncomfortable truth: this park stays busy from late morning through the entire evening with almost no letup. There is no “afternoon lull” at EPCOT.
| Time (ET) | Avg Wait | Verdict |
|---|---|---|
| 8:00 AM | 30 min | ✅ Only good window |
| 9:00 AM | 39 min | Acceptable |
| 10:00 AM – 5:00 PM | 47–55 min | 🔴 Elevated all day |
| 6:00 PM | 49 min | Still heavy |
| 8:00 PM | 40 min | Slight improvement |
Strategy: EPCOT rope drop is non-negotiable. Get Guardians of the Galaxy and Test Track done before 10 AM. After that, there’s no timing trick that meaningfully reduces waits. Lightning Lane or a slow day are your only other options.
Animal Kingdom: Timing Barely Matters (But Morning Is Still Best)
Animal Kingdom has the flattest wait curve of any park we track. The range from best to worst hour is only 26 minutes — far smaller than any other park.
| Time (ET) | Avg Wait | Verdict |
|---|---|---|
| 7:00 AM (early entry) | 21 min | ✅ Best if available |
| 8:00–9:00 AM | 37–38 min | Good |
| 10:00 AM – 1:00 PM | 40–47 min | ⚠️ Moderate peak |
| 4:00–6:00 PM | 29–35 min | ✅ Afternoon drop |
Strategy: Unlike other Disney parks, Animal Kingdom has a genuine afternoon improvement — waits drop in the late afternoon as many guests leave for dinner. The park also closes earlier than others, so mornings are still preferable. But if Animal Kingdom is your second park of the day, an afternoon arrival works better here than anywhere else.
Epic Universe: Morning Is the Only Easy Window
As the newest major theme park in the world, Epic Universe is drawing consistent demand. Waits spike fast after opening and stay elevated for most of the day.
| Time (ET) | Avg Wait | Verdict |
|---|---|---|
| 8:00 AM | 31 min | ✅ Best window |
| 9:00 AM | 45 min | Building |
| 10:00 AM – 3:00 PM | 60–68 min | 🔴 Peak hours |
| 6:00–8:00 PM | 35–46 min | Improving |
| 9:00 PM | 28 min | ✅ Evening recovery |
Strategy: Epic Universe operates similarly to Hollywood Studios: rope drop or evening are the only viable low-wait windows. The midday peak (10 AM–3 PM) averages over 60 minutes per ride. If you’re visiting for a full day, plan your big rides in the first hour, then use the afternoon for dining, exploration, and low-capacity experiences before hitting rides again at 7 PM.
Islands of Adventure: Morning Priority, Then Expect Long Waits
Hogwarts Castle and Hagrid’s Motorbike Adventure are two of the most-waited rides in the world, and it shows in the data.
| Time (ET) | Avg Wait | Verdict |
|---|---|---|
| 8:00–9:00 AM | 41–42 min | ✅ Best window |
| 10:00 AM – 7:00 PM | 45–58 min | 🔴 Elevated all afternoon |
| 8:00–9:00 PM | 24–32 min | ✅ Evening drop |
Strategy: Hagrid’s Motorbike Adventure routinely posts 90–120 minute waits mid-day. Hit it first at park open, or use Virtual Queue if available. IoA is one of the few parks where evening offers a significant improvement — the last hour before close often has sub-30-minute waits even on busy days.
Universal Studios Florida: Go at Open, Not at Dinner
Universal Studios Florida has a counter-intuitive pattern: the park starts relatively manageable and gets progressively worse until late afternoon, then gradually improves.
| Time (ET) | Avg Wait | Verdict |
|---|---|---|
| 9:00 AM | 13 min | ✅ Best window |
| 10:00 AM | 19 min | Still good |
| 11:00 AM – 4:00 PM | 31–49 min | 🔴 Builds steadily |
| 4:00 PM | 49 min | 🔴 Peak hour |
| 7:00–9:00 PM | 19–28 min | ✅ Evening recovery |
Strategy: The worst strategy at Universal Studios Florida is arriving at dinner time. Many guests eat at CityWalk then walk into USF around 5–6 PM — right into the worst of the crowd buildup. Go at opening or plan to arrive after 7 PM instead.
Disneyland: Rope Drop Is King (13 Minutes Per Ride at 8 AM)
Disneyland’s best time is also the most straightforward of any park we analyzed: 8 AM is significantly better than any other hour, and by a wide margin.
| Time (PT) | Avg Wait | Verdict |
|---|---|---|
| 8:00 AM | 13 min | ✅ Best of any park on this list |
| 9:00 AM | 21 min | Still good |
| 10:00 AM – 1:00 PM | 31–34 min | 🔴 Peak window |
| 2:00–5:00 PM | 29–31 min | Moderate |
| 9:00–10:00 PM | 21–25 min | Good evening option |
| 11:00 PM | 15 min | ✅ Very quiet if park is open |
Strategy: At 13 minutes average per ride, Disneyland’s 8 AM window is the lowest-wait hour of any park we track. The gap between rope drop and peak is dramatic: waits more than double in two hours. Get there at opening, hit your top 3 rides before 10 AM, then adjust based on how busy it feels. Evening (9 PM onward) is also genuinely good.
Disney California Adventure: Early or Nothing
DCA starts well but peaks fast. Unlike Disneyland next door, there’s no significant afternoon lull.
| Time (PT) | Avg Wait | Verdict |
|---|---|---|
| 8:00 AM | 30 min | ✅ Best window |
| 9:00 AM | 43 min | Building quickly |
| 10:00 AM – 9:00 PM | 41–52 min | 🔴 Elevated most of the day |
Strategy: Radiator Springs Racers is the ride that drives DCA’s wait time average more than any other. Hit it at 8 AM or use Lightning Lane. The park doesn’t have a meaningful slow window after 9 AM, so rope drop and ride prioritization matter more here than almost anywhere else.
The Full Rankings: Best to Worst for Rope Drop
| Park | Opening Hour Avg Wait | Peak Hour Avg Wait | Best Advice |
|---|---|---|---|
| Disneyland | 13 min | 34 min | Rope drop by far |
| USF | 13 min | 49 min | Rope drop only |
| Magic Kingdom | 16 min | 36 min | Open or late evening |
| Epic Universe | 31 min | 68 min | First hour or after 7 PM |
| EPCOT | 30 min | 55 min | Open only, no relief later |
| Disney California Adventure | 30 min | 52 min | Open or skip |
| Animal Kingdom | 37 min | 47 min | Morning or late afternoon |
| Islands of Adventure | 41 min | 58 min | Open or after 8 PM |
| Hollywood Studios | 29 min | 72 min | Open or after 7 PM — nothing in between |
Methodology
All data comes from Theme Park Shark’s proprietary wait time tracking system, which collects live wait times from all 9 parks every 10 minutes. The analysis in this guide covers 116,000+ individual ride wait time records. All times have been converted to local park time (Eastern for Florida parks, Pacific for California parks). Data collection began in March 2026 and is updated continuously. Averages will shift as the dataset grows.
This guide is updated weekly. The most current version will always reflect the latest data from our tracking system.
Frequently Asked Questions
What is the best time to visit Disney World?
For Magic Kingdom, 8 AM at park open averages just 16 minutes per ride. Hollywood Studios is best in the first hour (8–9 AM) before waits double by late morning. EPCOT has no good window after 10 AM — rope drop is essential. Animal Kingdom is the most forgiving, with late afternoon (4–6 PM) offering a secondary low-wait window.
Is rope drop always the best strategy?
At most parks, yes. But the advantage varies significantly. At Disneyland, rope drop (8 AM) is 2.6x better than peak (34 vs 13 min). At Animal Kingdom, the difference between best and worst is only 26 minutes — timing matters much less there.
What is the best time to visit Epic Universe?
8 AM at park open, averaging 31 minutes per ride. Waits double by 10 AM and stay elevated through 3 PM. The park has a secondary window after 7 PM (42 min average) as crowds thin before close.
Is there a good time to visit Hollywood Studios without a long wait?
The first hour of the day (8–9 AM) averages 29 minutes. After 9 AM, waits climb quickly to 60-70+ minutes. After 7 PM, waits drop back to the 27–47 minute range. Everything between 9 AM and 7 PM requires Lightning Lane or patience.
When should I visit Disneyland?
8 AM at rope drop is the lowest-wait window of any park on this list at 13 minutes average. Waits more than double within two hours. Late evening (10–11 PM when the park is open that late) is also a strong option at 15–21 minutes.
Related: Disney World Crowd Calendar 2026 | Lightning Lane Guide 2026 | Disney World Ticket Prices 2026
Data source: Theme Park Shark proprietary wait time tracking system. 116,000+ records across 9 parks. Updated weekly.
Discover more from Theme Park Shark
Subscribe to get the latest posts sent to your email.