
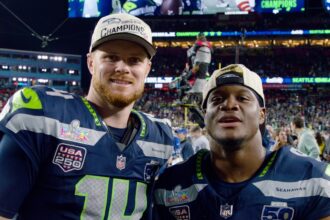
Super Bowl MVP Kenneth Walker III and Sam Darnold Head to Disneyland for Victory Cavalcade
🎧 Listen to this article: Your browser does not support audio. Super Bowl MVP Kenneth Walker III and quarterback Sam…

Pixar Debuts Hoppers Super Bowl Spot Ahead of March Release
🎧 Listen to this article Your browser does not support audio. Disney and Pixar debuted a 30-second spot for Hoppers…

Xfinity Reunites Original Jurassic Park Cast in Super Bowl LX Commercial
🎧 Listen to this articleYour browser does not support the audio element.Xfinity made its first-ever national Super Bowl appearance during…
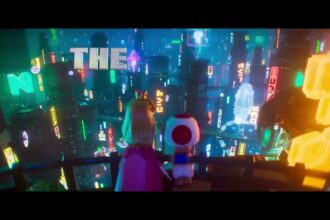
The Super Mario Galaxy Movie Drops Wild ‘Level Up’ Super Bowl LX Teaser
Nintendo and Illumination just dropped a 30-second Super Bowl LX teaser for The Super Mario Galaxy Movie, and it is…
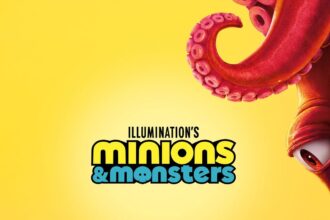
Minions and Monsters Drops First Trailer During Super Bowl LX
🎧 Listen to this article: Your browser does not support audio. Universal Pictures just dropped the first trailer for Minions…
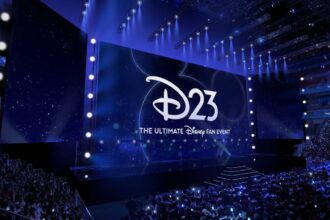
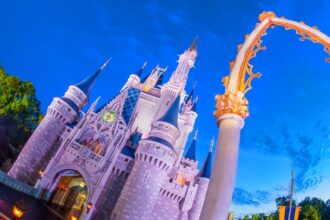
D23 Ticket Sale Hinted for Early April 2026
D23: The Ultimate Fan Event tickets could be going on sale in early April 2026, according to a hint dropped…

Epic Universe Complete Guide 2026: Every Land, Ride, and Insider Tip
The complete guide to Universal Epic Universe in 2026. Every ride, restaurant, tip, and strategy you need for the most…

Every Disneyland Ride Ranked: The 2026 List That Starts Arguments
We ranked all 33 rides at Disneyland Park from worst to best for 2026. From Astro Orbitor to Indiana Jones…
Walt Disney World Ride Rankings: Which Attractions to Skip
Planning a Walt Disney World trip in 2026? With over 50 rides spread across four theme parks, knowing which attractions…
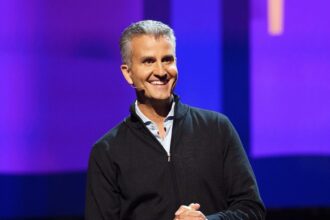
Incoming Disney CEO Josh D’Amaro Teases Big Plans for Epic Games Partnership
🎧 Listen to this article: Your browser does not support audio. Incoming Disney CEO Josh D’Amaro is signaling that the…