
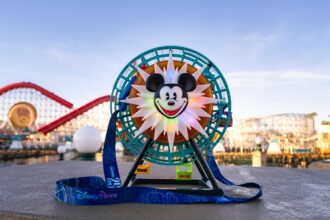
Disney’s New Pixar Pal-A-Round Bucket Reacts to Park Locations With ‘Magic Inside’ Technology
🎧 Listen to this article: Your browser does not support audio. Disney California Adventure is celebrating its 25th anniversary with…
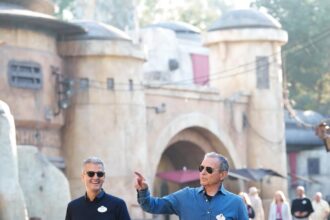
Bob Iger and Josh D’Amaro Celebrate CEO Appointment With a Morning at Disneyland
🎧 Listen to this article: Your browser does not support audio. Outgoing Disney CEO Bob Iger and incoming CEO Josh…

What’s New at Universal Orlando in February 2026: Mardi Gras, Epic Universe, and Refurbishments
February 2026 is a packed month at Universal Orlando Resort. Mardi Gras has officially kicked off, Epic Universe continues to…

The Muppet Show Dominates Wednesday Night Ratings, Tops Key Demo Across All Networks
The Muppet Show revival pulled 3.07 million viewers on ABC and topped every broadcast network in the Adults 18-49 demo.…

Best Time to Visit Disneyland in 2026: Month-by-Month Guide
Planning a Disneyland trip in 2026? Our month-by-month guide covers crowds, weather, special events like the Food & Wine Festival,…
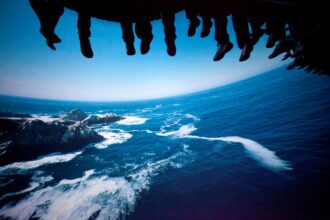
Soarin’ Over California Is Back: The Classic DCA Ride Returns Today for a Limited Run
🎧 Listen to this article: Your browser does not support audio. It's official — Soarin' Over California is back. Starting…
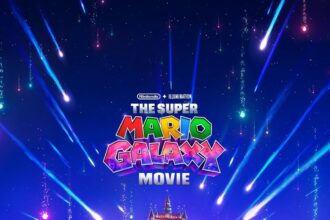
The Super Mario Galaxy Movie Hits Theaters April 1 — Here’s How Universal Parks Are Already Living the Adventure
The Super Mario Galaxy Movie is officially set to launch in theaters across the United States on April 1, 2026,…

Your Complete Guide to Valentine’s Day Treats and Experiences at Disney Springs
🎧 Listen to this article: Disney Springs is pulling out all the stops for Valentine’s Day 2026, with a delicious…

Daredevil: Born Again Season 2 Is Now Streaming on Disney+ — What It Means for Avengers Campus
Daredevil: Born Again Season 2 is now streaming on Disney+. The second season officially premiered today, March 24, 2026, as…
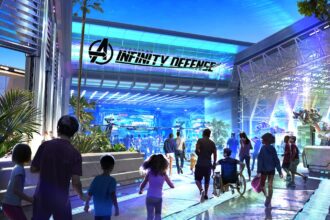
Avengers Campus Expansion Hits Major Construction Milestone as Building Takes Shape at Disney California Adventure
🎧 Listen to this article:Your browser does not support the audio element.The Avengers Campus expansion at Disney California Adventure has…