I track posted wait times at nine Disney and Universal parks every 10 minutes. In September 2026 that added up to more than a quarter million readings during open hours. Here’s what the month looked like, park by park.
Quick version: September was a great month to visit. Seven of the nine parks averaged under 30 minutes, and the first two days of the month were the calmest of all.
Average posted wait by park, September 2026
| Park | Average posted wait | Busiest day | Calmest day |
|---|---|---|---|
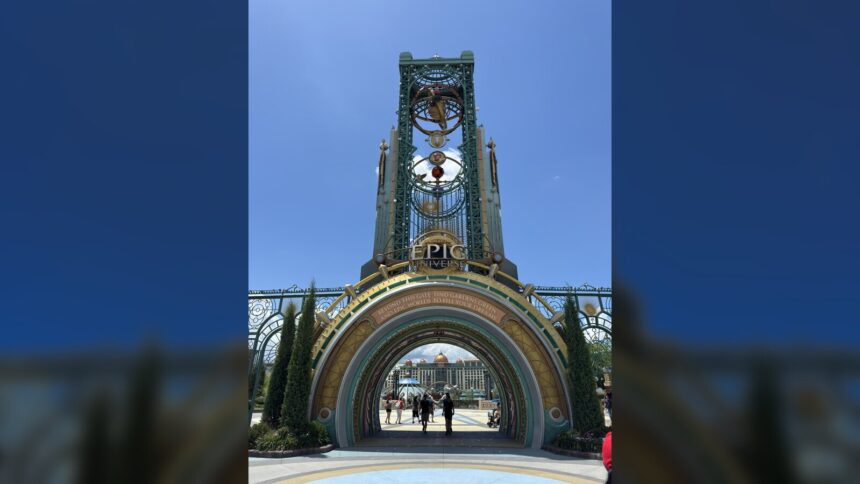
| Epic Universe | 35.8 min | Sunday, September 6 (50.1 min) | Wednesday, September 2 (20.4 min) |
| Hollywood Studios | 34.8 min | Saturday, September 26 (46.2 min) | Wednesday, September 2 (18.3 min) |
| EPCOT | 27.0 min | Friday, September 25 (35.2 min) | Wednesday, September 2 (17.2 min) |
| Animal Kingdom | 21.6 min | Sunday, September 6 (31.7 min) | Tuesday, September 1 (8.4 min) |
| Disney California Adventure | 21.3 min | Monday, September 21 (34.1 min) | Tuesday, September 1 (12.6 min) |
| Universal Studios Florida | 19.5 min | Sunday, September 6 (28.8 min) | Wednesday, September 2 (12.6 min) |
| Disneyland | 19.0 min | Monday, September 21 (33.8 min) | Thursday, September 10 (10.1 min) |
| Magic Kingdom | 18.5 min | Saturday, September 26 (27.1 min) | Tuesday, September 1 (11.3 min) |
| Islands of Adventure | 17.1 min | Sunday, September 6 (30.2 min) | Wednesday, September 2 (11.3 min) |
Epic Universe and Hollywood Studios were the two busiest parks again. Even so, both averaged under 36 minutes.
The longest average wait at each park
- Epic Universe: Harry Potter and the Battle at the Ministry, 99.7 min. Mine-Cart Madness was right behind at 95.5.
- EPCOT: Guardians of the Galaxy: Cosmic Rewind, 79.9 min.
- Disney California Adventure: Radiator Springs Racers, 62.2 min.
- Hollywood Studios: Slinky Dog Dash, 60.1 min.
- Islands of Adventure: Hagrid’s Magical Creatures Motorbike Adventure, 59.4 min.
- Magic Kingdom: TRON Lightcycle / Run, 53.1 min.
- Animal Kingdom: Avatar Flight of Passage, 47.1 min.
- Disneyland: Star Wars: Rise of the Resistance, 44.8 min.
- Universal Studios Florida: Harry Potter and the Escape from Gringotts, 29.6 min.
When lines were shortest
At seven of the nine parks, 9am was the shortest hour of the day. Rope drop really works.
Hollywood Studios and Animal Kingdom flipped that. Their shortest lines came at 8pm, at 25.5 and 13.8 minutes on average. If you’re not a morning person, those two parks reward staying late.
At Epic Universe, 9am averaged 21.1 minutes. By noon it was 44.8, more than double.
What stood out to me
Labor Day weekend was the peak. Saturday, September 5 through Monday, September 7 were among the busiest days at almost every Orlando park.
Labor Day itself fell on Monday, September 7. Right before it, Tuesday, September 1 and Wednesday, September 2 were the calmest days at eight of the nine parks. Animal Kingdom averaged just 8.4 minutes on September 1.
The two California parks peaked on Monday, September 21, not over Labor Day.
Planning a trip? Check the live wait pages linked in the table. They update every 10 minutes all day.
How I measured this
These are posted wait times, read every 10 minutes from 9am to 9pm local time, September 1 to 30, 2026. A park’s daily number is the average across its open rides. The monthly number averages those days. Closed rides don’t count. Halloween Horror Nights houses are left out of Universal Studios Florida. Rides need at least 200 readings to be ranked.
Wait time data from ThemeParks.wiki.
Discover more from Theme Park Shark
Subscribe to get the latest posts sent to your email.